

Now that we've covered the basics of systems and how to represent them via Casual Loop Diagrams, we can start using the math inherent in the representation to make observations and assertions about the systems we're interested in. If there's a part of a system where you can trace influence (following the arrows) from an element through other elements and then back to where you started, you have a loop. By examining this loop in isolation, you can tell a story about how a change in the initial variable travels through the system and then comes back to further change the initial variable1 .
Whenever you have a loop, one of two archetypal stories apply. The first, this week's topic, is a story of change: growth, decay, or collapse. Note that none of these is inherently good or bad without more context about the system - a growing bank balance is probably good, a growing tumor is probably bad, and a growing elk population might be either (at least for a while). This story applies whenever the number of “opposite” connections in the loop is even2 (including zero3). This goes by a number of names: reinforcing loops, positive feedback loops4, and amplifying loops5. The basic way to show that a loop is reinforcing is to mark it with: R, +, or ↻. These can further be uniquely labeled so that the various loops in a diagram or story can be differentiated - either with a name or a number.
This is also a good time for two more general tips on drawing these diagrams. The first is that the causal arrows can be broken up by a || to indicate that there’s a delay in the response, something that operates significantly slower than other elements in the loop. The second is to think hard when diagramming human systems about whether variables cause a change directly, or through the perception of those variables. For an example, much digital ink over the last year was devoted to the “vibecession”, the mismatch between recent positive economic data and low sentiment, which may end up having serious consequences for Biden’s reelection. Usually people are at least somewhat connected to reality, so the “actual” variable should have a same-direction influence on the “perceived” variable, often with a delay.
Examples
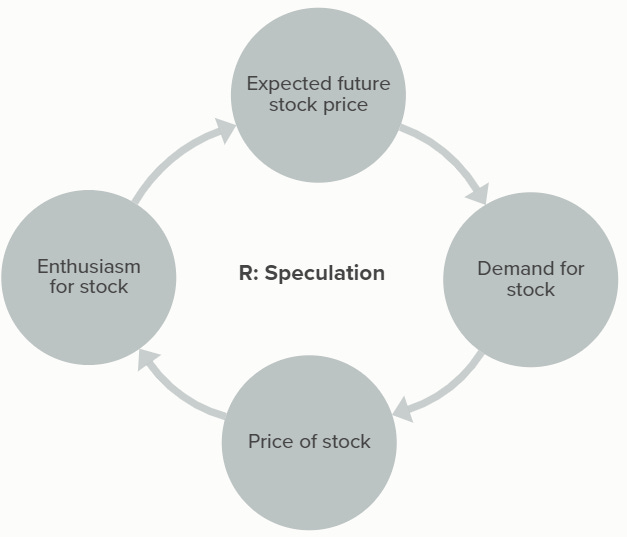
Note that there's no such thing as just a “growth” or just a “collapse” story - because the system diagram explains changes relative to some initial change, the same dynamics that lead to growth can lead to collapse. This is evident in the stock market, where speculation about a stock’s possible increase in value leads to its share price rising, fueling further speculation about possible future growth and leading to a bubble in valuation, and the moment something causes confidence to leave the system, the same mechanic causes the whole thing to come crashing down6.
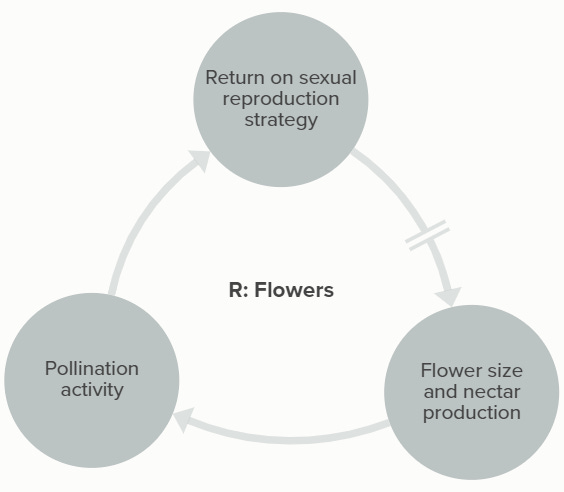
As another example, consider this article about changes in flower reproduction strategy. As pollinator populations decrease, some flowers are shifting away from sexual reproduction as a strategy, and as a result they are developing smaller flowers and less nectar as they invest the energy elsewhere. This makes the flowers less attractive to pollinators, ensuring they'll get even less attention; the article even imagines some species going completely asexual as a result. However, this same dynamic working in reverse is how flowers and pollinators co-evolved in the first place - more investment in flowers led to more pollinator attention, more sexual reproduction, and increased evolutionary advantage.
By now it should be clear that reinforcing loops (on their own) are destabilizing; things can only escalate so far in one direction before a system breaks. For example, check out this article from Sally Goerner about the consequences of economic inequality. The trend toward economic deregulation and privatization since the 1980s has permitted the growth of extractive economic forces past an important threshold, where the relevant players gained enough power to shift strategy toward rent-seeking and regulatory capture. More of the economy’s resources are devoted to preserving wealth than creating new wealth, which increases income inequality and makes it increasingly tempting to try to maintain relative status by “playing the game”. Eventually, this stagnation leads to some form of system breakdown: revolution, depression, etc.
What are some reinforcing loops from your work or everyday life?
Though I say “initial variable”, because it’s a loop, any variable could be thought of as the starting point with equal validity.
If this sounds like multiplying positive and negative numbers, it is! This is basically the chain rule from calculus: if A → B → C, then dC/dA = dC/dB ⋅ dB/dA, so the sign of the end result will just collect the sign of all the intermediate steps.
I have spent much of my life indignant about having to clarify that zero counts as a number, but as I've matured I've realized there are enough edge cases in everyday language to let it go.
The problem with this name is that “positive feedback” is more or less synonymous with “praise” in common English, and “negative feedback” with criticism/complaint. While this isn't a completely off-base association (positive feedback meaning “more of this please” and negative meaning “less of this please”), the implied value judgments don't belong.
The following paragraph demonstrates the problem with this name.
As it happens, as I'm writing this paragraph, the person sitting next to me on the plane is watching Dumb Money, the movie about the GameStop stock bubble - there was certainly more going on than just this reinforcing loop, I did have a friend that was all in on the 💎🙌🚀🌕 strategy. Not that I eavesdrop on the people next to me on planes.