


Starting to Map Systems
Systems Thinking, Week 3

Now that we’ve covered the basic terminology1 and intellectual history of systems, let’s talk about building some!
Informal Systems
At the simplest level, you already know how to represent systems: write down the various ideas in your head about the component parts of something, and then draw lines connecting the elements that you see a relationship between - basically the popular conception of a mind map. This at least puts things on the page to consider and critique.
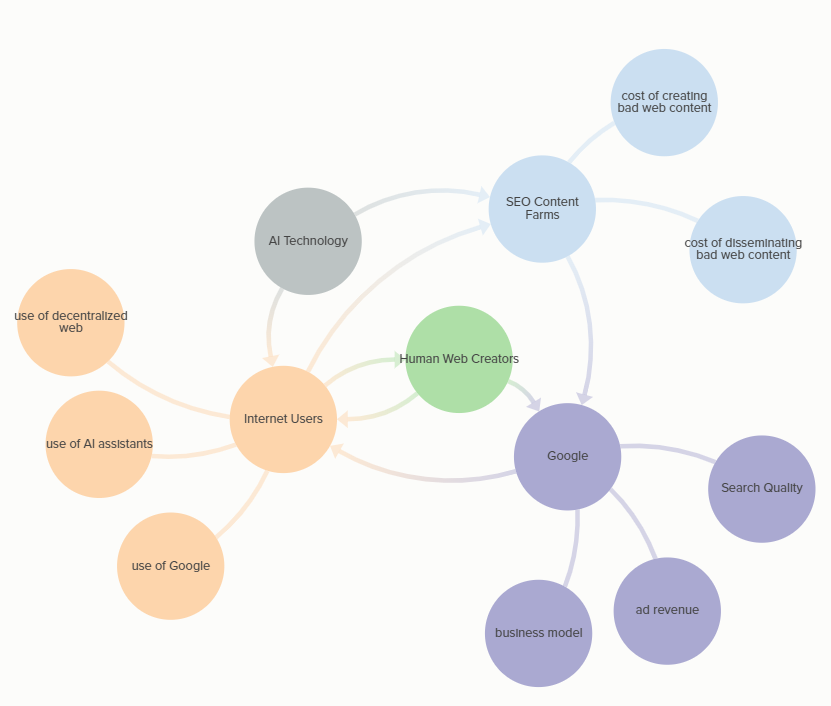
The next step up is to build an influence map. In this, enumerate the actors/agents in the system, and then draw arrows (instead of just lines) from the element in the direction of the influence (from the one acting to the one being acted upon). This is usually discernible from the way the system would be talked about in everyday language: A → B could sound like “A enables B”, “A causes B”, “B depends on A”, etc. The relevant attributes of all these actors can also be brought in, connected by lines to the relevant actors. For example, I read this article about how ChatGPT might change the internet by effectively acting as an information virus/parasite. The main actors in the story are the people churning out bad web content to drive traffic to their sites, Google, web users, and people that have real web content they want to get in front of people. An influence map for this might look something like this (I built this in Kumu, which is a little finicky but has some nice features):
Soft Systems Methodology
Let me take a quick detour to show you how even just a little bit of systems formality can go a long way. Soft Systems Methodology (SSM) is a technique developed by Peter Checkland for using systems maps to deal with complicated human problems. Bob Williams gives a fantastic overview of the whole process2. The first step is to identify the problem situation - some complicated, sticky set of interconnected pieces that’s leading to outcomes you don’t like (and presumably, that none of the actors intend, or that stakeholders don’t like). The second step is to develop what Checkland calls a “rich picture” of the situation - literally a picture combining structures, people, issues, conflicts, etc.
Third, work to define the parameters of systems that lead to relevant activities. These activities are the goals of the system from the perspective of the various stakeholders. For example, if you’re looking at a public school, your activities certainly include “educate children” but also “provide food to children with food insecurity”, “provide hearing screenings to children”, “provide income and job security to teachers based on their standing with the union”, “audition principals for higher-level administration”, “provide a place for kids to go while parents are working”, etc. These objectives are called holons because they have their own organizing logic within the larger system. A full definition of a holon includes the elements Checkland summarized using the mnemonic CATWOE: customers (the beneficiaries of the holon), actors (those who do the work that leads to the objective), transformation (the specific input-to-output that’s desired), Weltanschauung3 (the underlying beliefs that make the transformation important), owners (those who are responsible for the system and could dissolve it), and environment (other relevant outside influences on the system).
Once the system parameters are defined, the fourth step is to design a minimum candidate system that might accomplish the desired transformation: identify all the necessary activities, then arrange them in order of logical dependency and connect with arrows (presumably this isn’t linear but instead will have activities happening in parallel, some of which will enable further activities to take place). Then add a way to measure the performance and you have a candidate system; repeat for each holon. Fifth, head back to the real world: to what extent do the activities and measurement you identified exist in the real world, and how is it going? This might send you back to the previous step to integrate additional understanding. Sixth, identify systems from step 4 (or from revisiting) that could form the basis of improvements to the system performance and seem politically plausible; seventh, take action, monitor, and learn.
This is a complete conceptual package — you can go through this process to bring systems thinking into your work without ever going any deeper into theory. It’s a pretty prescriptive process, so what makes SSM “soft”? At a glance, it may seem like it’s because of the lack of quantitative work / simulation. That answer isn’t exactly wrong, but a fuller answer accounts for the level at which the systems are presumed to exist; in other words, it makes a claim about the nature of reality. In a hard systems approach, it is assumed/asserted that the system is a real thing or process that exists in the world and can be optimized; in the soft systems approach, “‘the system’ is the process of enquiry itself”. That is, rather than making an ontological claim about the system as something to be analyzed and optimized, it uses the idea of the system as an epistemological tool for reasoning about the current state and potential improvements in real-world situations. This is similar to the point I was making last week about systems being useful as a pragmatic tool for thinking through problems.
A Word on Variables
To move to the next level of analytical sophistication, we need to get really crisp about turning the attributes above into variables. As you might expect from the name, a variable is something that can change, but specifically that change can be measured or estimated, which requires that it be some quantifiable attribute. So, for example, “company strategy” is not a variable, but “company strategy robustness” could be - of course, variables could also be more objective, like “company revenue” or “elk population”. To account for variables being the subject of increase and decrease, keep all the measurements out of the variables themselves - “tolerance”, not “decreasing tolerance”; “ambient air temperature”, not “rising ambient air temperature”. Also be careful if your variable includes compounds like “milk and meat prices” - it can be OK to have it be a single variable if the individual components always act the same in the system you’re considering, but maybe find a higher-level concept that combines them (“animal-based food prices”?).
Causal Loop Diagrams
The most formal kind of system technique being considered (at least so far) is a Causal Loop Diagram. In this case, only include variables, and be explicit in your arrows whether a change in one direction in the source variable will lead to a change in the same or opposite direction in the destination variable - conventions include solid vs dashed lines, or labeling the arrow with a +/- or a S (for “same”) or O (for “opposite”). This creates a graph with all sorts of properties — exploring all the implications will take several more weeks, so buckle up. Once your diagram is done, you can talk through the logic by picking a starting place and following the logic through: A increasing means B will decrease, which decreases C but also decreases A, etc.
Here’s my diagram for the same article as above. Note that I used color to link the variables to the appropriate actors. This is my first time drawing one of these, so I’d be interested to hear your feedback or criticism.
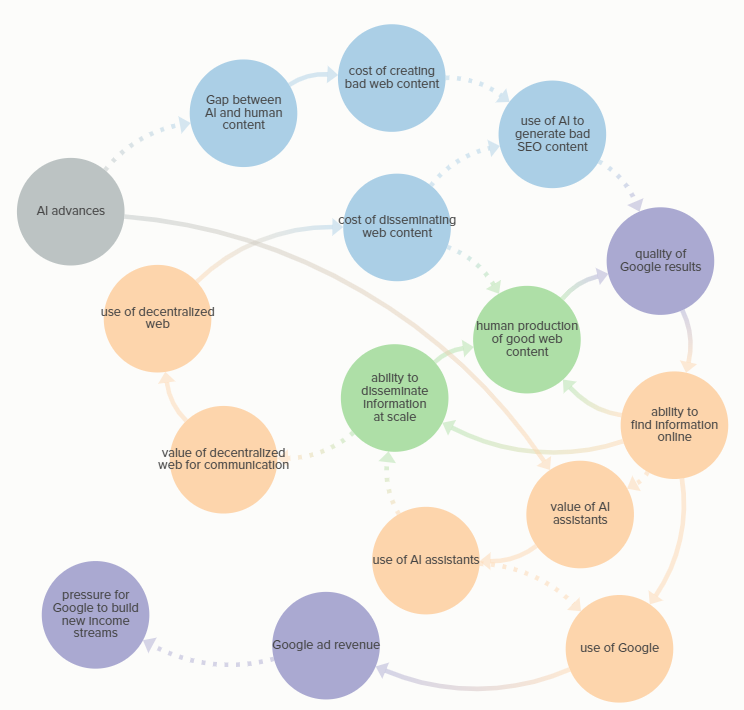
As for the walkthrough, here’s my attempt: as AI has advanced over the past few years, it has made it possible to provide text about as good as what a human can write when not trying hard (but at scale by being massively faster and cheaper). This greatly reduces the cost of creating the junky search engine optimization (SEO) content that drives up search results and drives traffic to sites, and dramatically increases the volume of this bad content that’s created. This serves to dilute the good content on the internet in Google search results, and makes it harder to find anything useful online. This drives people away from Google and reduces the ad revenue that Google makes, pressuring them to create new business models to make up for the lost revenue.
At the same time, other effects occur that create loops. The decrease in the ability to find information online reduces human interest in producing good content, both directly and by reducing the ability to disseminate information at scale. It also increases the relative value of AI assistants because they can give decent answers without searching; the underlying AI improvements also enhance this value. This will drive up the use of these assistants by the public, further reducing the use of Google and reducing the ability to disseminate information, because each person will exist in their own AI bubble. That reduction will actually increase the relative value of the decentralized web for communication and drive up its use, which increases the cost of disseminating bad content (because you have to pay the transaction costs, it adds friction to the system). This will somewhat decrease the human production of good content, but will have a larger effect on the production of garbage content (because it won’t be worth paying anything to get it to people).
OK just one more thing I want to say about the basics: Reisman and Oral give a three-dimensional taxonomy for systems: systems all exist on a continuum between adaptive and non-adaptive, between man-made and natural, and between open and closed.
Worth mentioning: by working through the process in a participatory way with an inclusive group of stakeholders, there should be fewer gaps and you’ll end with a shared vision and buy-in.
I have no idea why English-speaking people would use this word when “worldview” is a perfectly cromulent word that means the exact same thing.